The Truncated Exponential Distribution (TED)
To apply the method of Section 5.3.2 to the
doubly-bounded case, we need to choose the right
surrogate distribution.
A clue to the proper surrogate density can be
found by observing the marginal distribution
of an element of the input data for
UMS samples as  becomes large,
as we saw in Figures 4.1, and 5.7.
Mathematically, the surrogate density should also be the
maximum entropy density under the
applicable moment constraints.
This was true of the Gaussian and exponential densities
corresponding to Figures 4.1, and 5.7,
respectively. To get a clue, we repeated the experiment
of Figure 5.7, but with the double bound on the input data.
Figure 7.1 shows the result, in which the marginal of
becomes large,
as we saw in Figures 4.1, and 5.7.
Mathematically, the surrogate density should also be the
maximum entropy density under the
applicable moment constraints.
This was true of the Gaussian and exponential densities
corresponding to Figures 4.1, and 5.7,
respectively. To get a clue, we repeated the experiment
of Figure 5.7, but with the double bound on the input data.
Figure 7.1 shows the result, in which the marginal of  has a shape that could be approximated by a truncated exponential distribution
(with positive exponent).
has a shape that could be approximated by a truncated exponential distribution
(with positive exponent).
Figure:
Left: manifold sampling results using rejection sampling for  . Right, histogram of .
|
|
In fact, for data bounded to the interval ![$[0,1]$](img9.png) ,
the truncated exponential distribution is the maximum entropy distribution
under mean (first moment) constraints ([48], page 186).
Let's take a closer look at this distribution. For data
,
the truncated exponential distribution is the maximum entropy distribution
under mean (first moment) constraints ([48], page 186).
Let's take a closer look at this distribution. For data  in the
interval and exponent parameter
in the
interval and exponent parameter  (which can be positive or negative), the uni-variate
truncated exponential distribution is
(which can be positive or negative), the uni-variate
truncated exponential distribution is
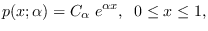 |
(7.2) |
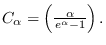
where
 The mean of this density is given by
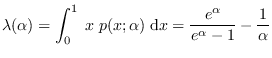 |
(7.3) |
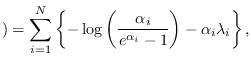
and the entropy is given by
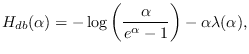 |
(7.4) |
where “db" indicates the doubly-bounded case.
The multi-variate TED is
 |
(7.5) |
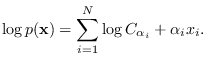
Thus, the entropy of the multivariate density of independent
truncated exponentials is therefore, for input
data constrained to the unit interval is
where
![$=[\alpha_1, \alpha_2 \ldots \alpha_N]$](img736.png) and
and
 is computed from
  using (7.3).
![\includegraphics[height=2.3in,width=5.0in]{x1x2unihist8-b.eps}](img728.png)