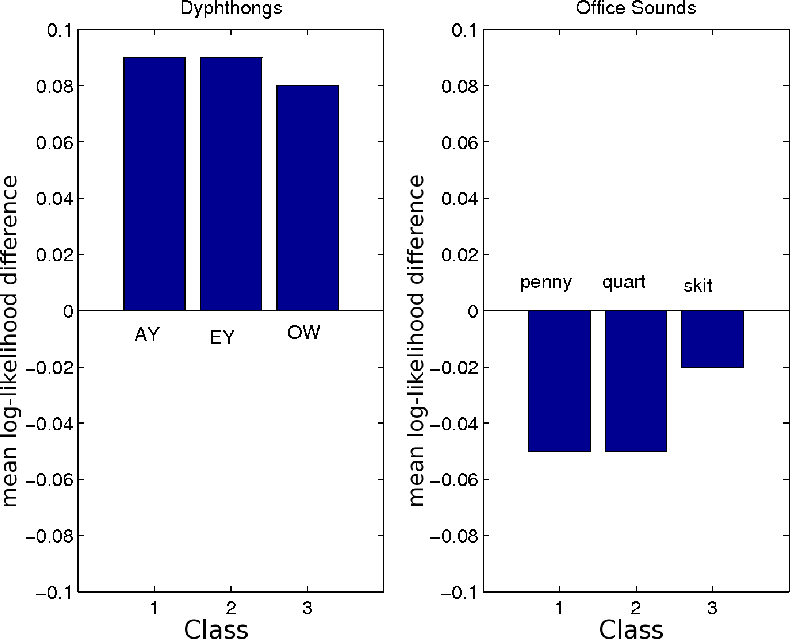
Figure 15.2 shows the results of the mean log-likelihood experiment.
The vertical scale of the bar-graph equals


 .
In the dyphthong data, the values are positive,
indicating that DAF-HMM produces a higher log-likelihood.
For office sounds data, DAF-HMM produces a lower log-likelihood.
This indicates that the spectral content of the dyphthongs
data was smoothly changing and feature time-derivatives
are more meaningful from a statistical modeling point of view.
For the abrupt sounds in the office sounds data, the
feature time difference were random and not predictable.
Thus, augmenting the features did more harm than good.
.
In the dyphthong data, the values are positive,
indicating that DAF-HMM produces a higher log-likelihood.
For office sounds data, DAF-HMM produces a lower log-likelihood.
This indicates that the spectral content of the dyphthongs
data was smoothly changing and feature time-derivatives
are more meaningful from a statistical modeling point of view.
For the abrupt sounds in the office sounds data, the
feature time difference were random and not predictable.
Thus, augmenting the features did more harm than good.
Figure:
Difference in  for DAF-HMM-corrected
and HMM for Dyphthongs (left) and Office sounds (right).
for DAF-HMM-corrected
and HMM for Dyphthongs (left) and Office sounds (right).
|
|
Below we list the results of the
classification performance experiment.
| Classification Error (percent) |
| Dyphthongs |
Office Sounds |
| HMM |
DAF-HMM |
HMM |
DAF-HMM |
| 9.6% |
7.5% |
0.66% |
1.64% |
The results are consistent with the mean log-likelihood
experiment. They indicate that augmenting the feature
is helpful for the Dyphthong data, but detrimental for
the office sounds data.