Why Maximum entropy?
The use of the maximum entropy criterion in
PDF design is well established [23],
and we provide an illustrative example here.
Suppose that we have a set of  training samples
 and a number of proposed PDFs,
 and would like to determine
which is a “better" fit to the data.
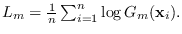
We can compare the PDFs based on the average log-likelihood
and would like to determine
which is a “better" fit to the data.
We can compare the PDFs based on the average log-likelihood
 But likelihood comparison by itself is misleading,
so we introduce another relevant quantity: the entropy of a distribution,
defined as
But likelihood comparison by itself is misleading,
so we introduce another relevant quantity: the entropy of a distribution,
defined as
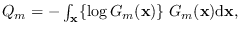 which is the negative of the theoretical value of
  .
It is a generalization of the concept of variance.
Distributions that spread the probability mass over
a wider area have higher entropy since the average height of the
distribution is lower.
.
It is a generalization of the concept of variance.
Distributions that spread the probability mass over
a wider area have higher entropy since the average height of the
distribution is lower.
Figure:
Comparison of entropy  and average log-likelihood
  for three distributions. The vertical lines are the locations of training samples.
|
|
The two concepts of and are compared in Figure 3.1 in which
we show three competing distributions:
 ,
,
 , and
, and
 .
The vertical lines represent the location of the training samples.
is the average height of the log-PDF value for these distributions and these samples.
Clearly
.
The vertical lines represent the location of the training samples.
is the average height of the log-PDF value for these distributions and these samples.
Clearly
But choosing
is very risky because it seems to be
over-adapted to the training samples.
Clearly
has lower entropy since
most of the probability mass is at places with higher
likelihood. Therefore, it has achieved
higher at the cost of lower , a suspicious situation.
On the other hand,  , but
, but  .
Therefore,
.
Therefore,
 has achieved higher than
 without
suffering lower . Choosing
over
is not risky.
Thus, if we always choose the reference hypothesis
that achieves the highest entropy for a given
without
suffering lower . Choosing
over
is not risky.
Thus, if we always choose the reference hypothesis
that achieves the highest entropy for a given
 and
and
 , and we are careful to use
data holdout (i.e. separation
of training and testing data) for estimation of
,
then we are confident that any increase in is due solely to
the choice of better features.
The features are, in short, more descriptive of the data
because the “unobserved" dimensions,
as we prevoiusly defined, are distributed in the broadest
possible way (highest entropy).
This highest-entropy distribution, which is
found by maximizing the entropy of
, and we are careful to use
data holdout (i.e. separation
of training and testing data) for estimation of
,
then we are confident that any increase in is due solely to
the choice of better features.
The features are, in short, more descriptive of the data
because the “unobserved" dimensions,
as we prevoiusly defined, are distributed in the broadest
possible way (highest entropy).
This highest-entropy distribution, which is
found by maximizing the entropy of
 over
over  , is denoted by
 .
More precicely,
.
More precicely,
![\includegraphics[width=3.0in]{overtrain.eps}](img300.png)