For a small number of sinusiods, the total number of
parameters for the SINAR model is small, so
the feature PDF can be approximated by Gaussian mixtures, etc.
The function
software/module_sinar_test.m implements
the acid using Gaussian mixtures test with method='gmm'.
However, for more sinusoids, a PDF estimation method
more suited for SINAR should be used.
The fixed parameters for the SINAR
model of AR order  and
and  sinusoids
include the AR parameter estimates
sinusoids
include the AR parameter estimates
 ,
,
![${\bf a}=[a_1,a_2 \ldots a_P]$](img1057.png) ,
the vector of frequencies
,
the vector of frequencies  ,
and the
,
and the  -dimensional vector of
real and imaginary amplitudes
-dimensional vector of
real and imaginary amplitudes  .
Let
.
Let  be an arbitrary (real data) hypothesis
and assume we want to estimate
be an arbitrary (real data) hypothesis
and assume we want to estimate
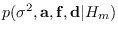 .
We make the simplifying assumption that
the AR and sinusoidal parameters are independent:
.
We make the simplifying assumption that
the AR and sinusoidal parameters are independent:
If we expand
we can implement
 as a histogram.
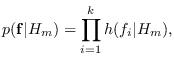
If we assume the individual frequencies are independent,
we have
as a histogram.
If we assume the individual frequencies are independent,
we have
where  is the frequency histogram for class .
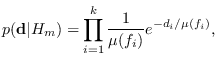
In addition, we can assume a standard exponential distribution for the
squared magnitudes,
is the frequency histogram for class .
In addition, we can assume a standard exponential distribution for the
squared magnitudes,
where  can be constant or can depend on the frequency.
In the second case, a means of estimating
should be used.
These ideas are implemented by the function
software/spect_hist.m.
The function
software/module_sinar_test.m implements
the acid using histogram with method='hist'.
can be constant or can depend on the frequency.
In the second case, a means of estimating
should be used.
These ideas are implemented by the function
software/spect_hist.m.
The function
software/module_sinar_test.m implements
the acid using histogram with method='hist'.